We were commissioned from one of our clients about a year and a half ago to create reports for their SpiraTeam test management tool, which they are implementing. Their preliminary ideas were also sent in excel format.
They came up with completely reasonable reporting needs, ones that our team is happy to work on, but we didn’t faint from the reporting tool for implementation. But when choosing the tool, we also fully understood the customer’s perspectives, as it was a pilot project, so it was the most obvious (cost-effective) for them in addition to their existing licenses. If, on the other hand, they succeed and make friends across the company with the opportunities offered by the new development, they can still spend on a state-of-the-art business intelligence software package to take advantage of the opportunities better, diversify and look better without wasting the basics of reporting.
Until the start of the project, our team only knew about this test management tool, so of course, our first thing was to start reading about its possibilities and its use, so that we could get a little more prepared for the first joint consultation with the client.
The SpiraTeam
Developed by Inflectra, Maryland, the easy-to-use tool provides customizable internal reports, is well parameterized, and has extensive support for all stakeholders in the testing process. However, its internal reporting can only serve very basic reporting needs, and the information it provides can sometimes be misleading. At the same time, there are many tools available on the market that offer far more options, although, in exchange for the additional service, the goods are also higher.
We were surprised to find that the tool has internal reports that looked quite customizable and appealing some statements provide the visualizations the client wants to implement. This is how the question arose: Why does the client want to have reports that are already available in the system by default?
Well… our question was answered very quickly: Spira is undoubtedly a well-parameterized tool and can broadly support all stakeholders and stages of the testing process, but its internal reporting can only serve very basic reporting needs, and the information in the statements is sometimes even misleading.
As we already had experience with reporting based on other test management tools, based on these our fears about the project were the database structure under Spira, as in the case of a reporting project a lot depends on this, including the proportion of database and BI expert.
Knowing the reporting needs and reporting tool, we chose the path to build the visualizations expected by the customer on database views and tables of daily historical data filled with scheduled stored procedures.
In a project, mapping and understanding a database structure unknown to us, even with a description, is a very time-consuming and complicated task, so we waited with great excitement with the database colleague for the first day spent on the project when we were first confronted with it.
On the other hand, we were able to show the client a reporting initiative on the first day (!), Which reassured the client that the project could be successful and gave us a momentum that lasted until sharpening. This, of course, could have happened not only because we understood what we were doing, but also because Spira’s database structure was one of the most transparent, clearest we’ve ever encountered with a “boxed product”. Completely clean board and field names join, and prefabricated views make it easy to implement individual needs.
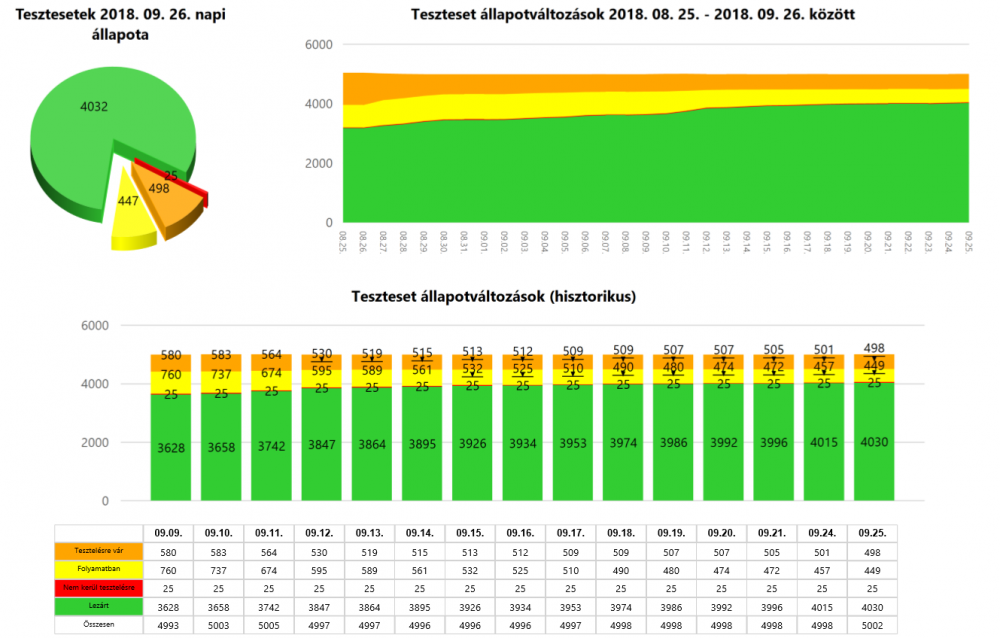
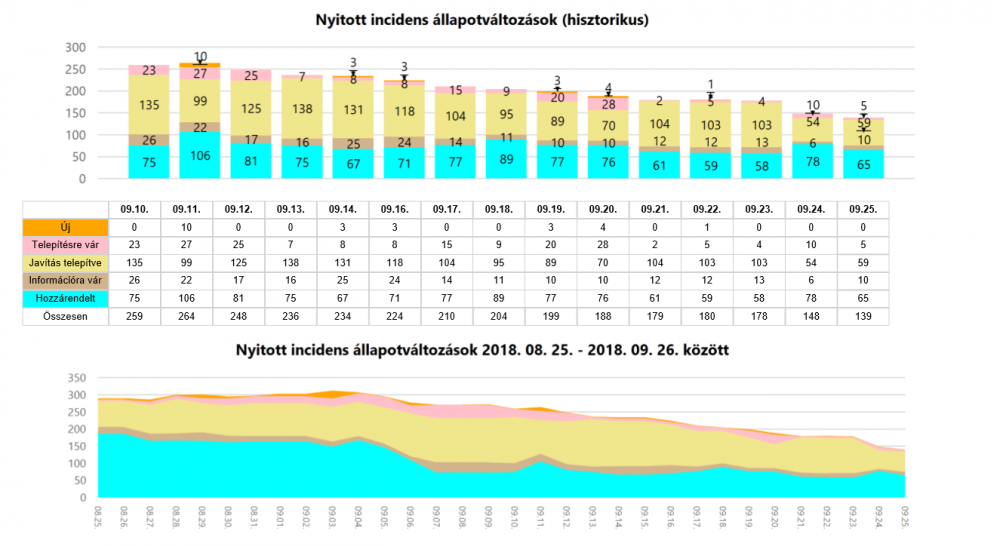
And there were plenty of individual needs: Company-level project overview, Top X error, daily status changes, average times spent in statuses, and more. etc And these enhancements have made it possible to create company-wide standard statements that have so far been collected into excel and PowerPoint presentations by hand, with tiring and time-consuming work. Thus, with reports now coming up with a few clicks, the time saved can be spent on “more meaningful” activity.

Of course, the success of a project also depends on the commitment and expertise of the customer, and in this case, fortunately, there was no shortage of this either: we were able to clarify the issues almost immediately, so the development went smoothly throughout.
The project was finally completed successfully, and even after that there were report requests, modifications, refinements, and even the “verb” is spreading within the company and the reports we produce are already considered the official reporting of Spira.


We hope that with the spread of the “verb”, there will be an increasing demand (and, in parallel, a budget allocated to it) to make the most of and want to make the most of the opportunities with a more modern reporting tool.
We think here that, for example, by introducing a semantic layer (this creates the connection between the database and the business layer), a business user who does not understand the database at all would be able to create reports and management dashboards without the help of an IT colleague (self-service BI). , so external assistance should only be used to meet more complex needs. This semantic layer would also ensure the introduction of a unified glossary within the company, for example, so that in each report all users of the company understand the same number of open or modified incidents on a given day. Nor would it be a problem for all project managers and test managers to receive an e-mail from time to time, which would only provide key information about their projects in pdf format, or by introducing a series of data access rights to solve the same problem on the web reporting portal. report to show each user only information about their projects, the huge advantage of this is that only one report needs to be maintained.
In summary, what can be extracted from SpiraTeam reporting? It is limited only by the capabilities of the reporting tool, the imagination, and the budget.

